This is an online course on data visualization for upskilling professionals in all sectors running 16. May – 10. July 2022
Navigation
OverviewCourse Description
Teaching Approach
Topics & Schedule
Requirements, Fees and Waivers
How to apply
FAQs
Apply
Team
E-mail us
Course Description
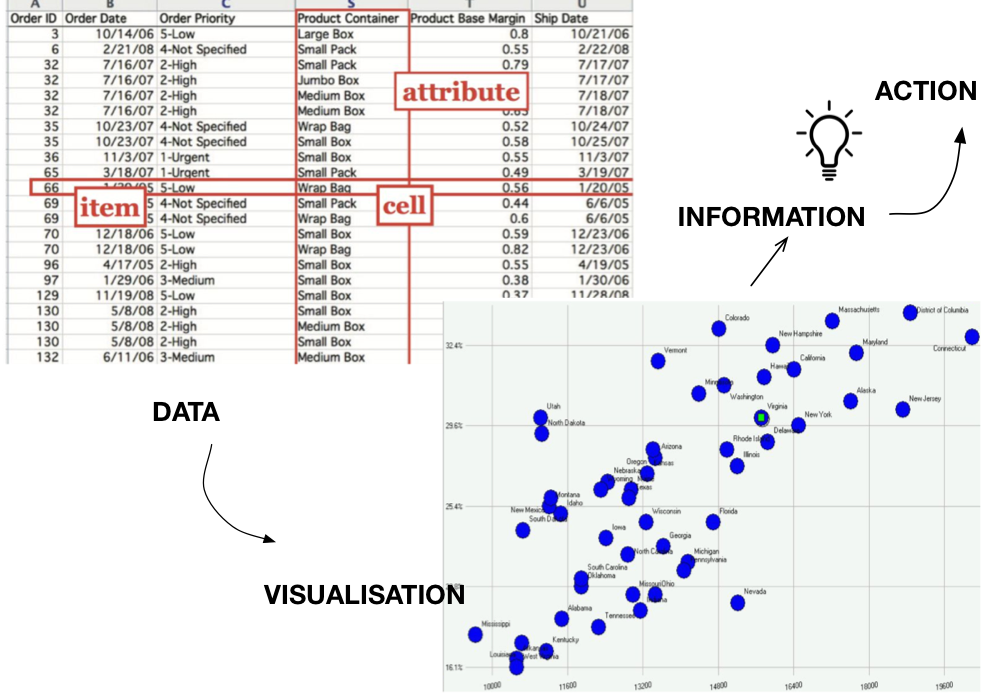
This online course aims to equip participants with the skills to use visualisation to create insight, to improve question-answering, information discovery, to support informed decision-making and to create value from data.
The course is NOT
- about creating dashboards,
- a D3, Leaflet, GGplot or other visualisation library programming course,
- a Tableau, PowerBI, SAS or other commercial visualisation tool course.
This course WILL
- help you to develop analytical thinking and engage with your data,
- teach you how to handle ambiguity in your data,
- help you to complement your domain expertise with creativity for problem solving and knowledge discovery,
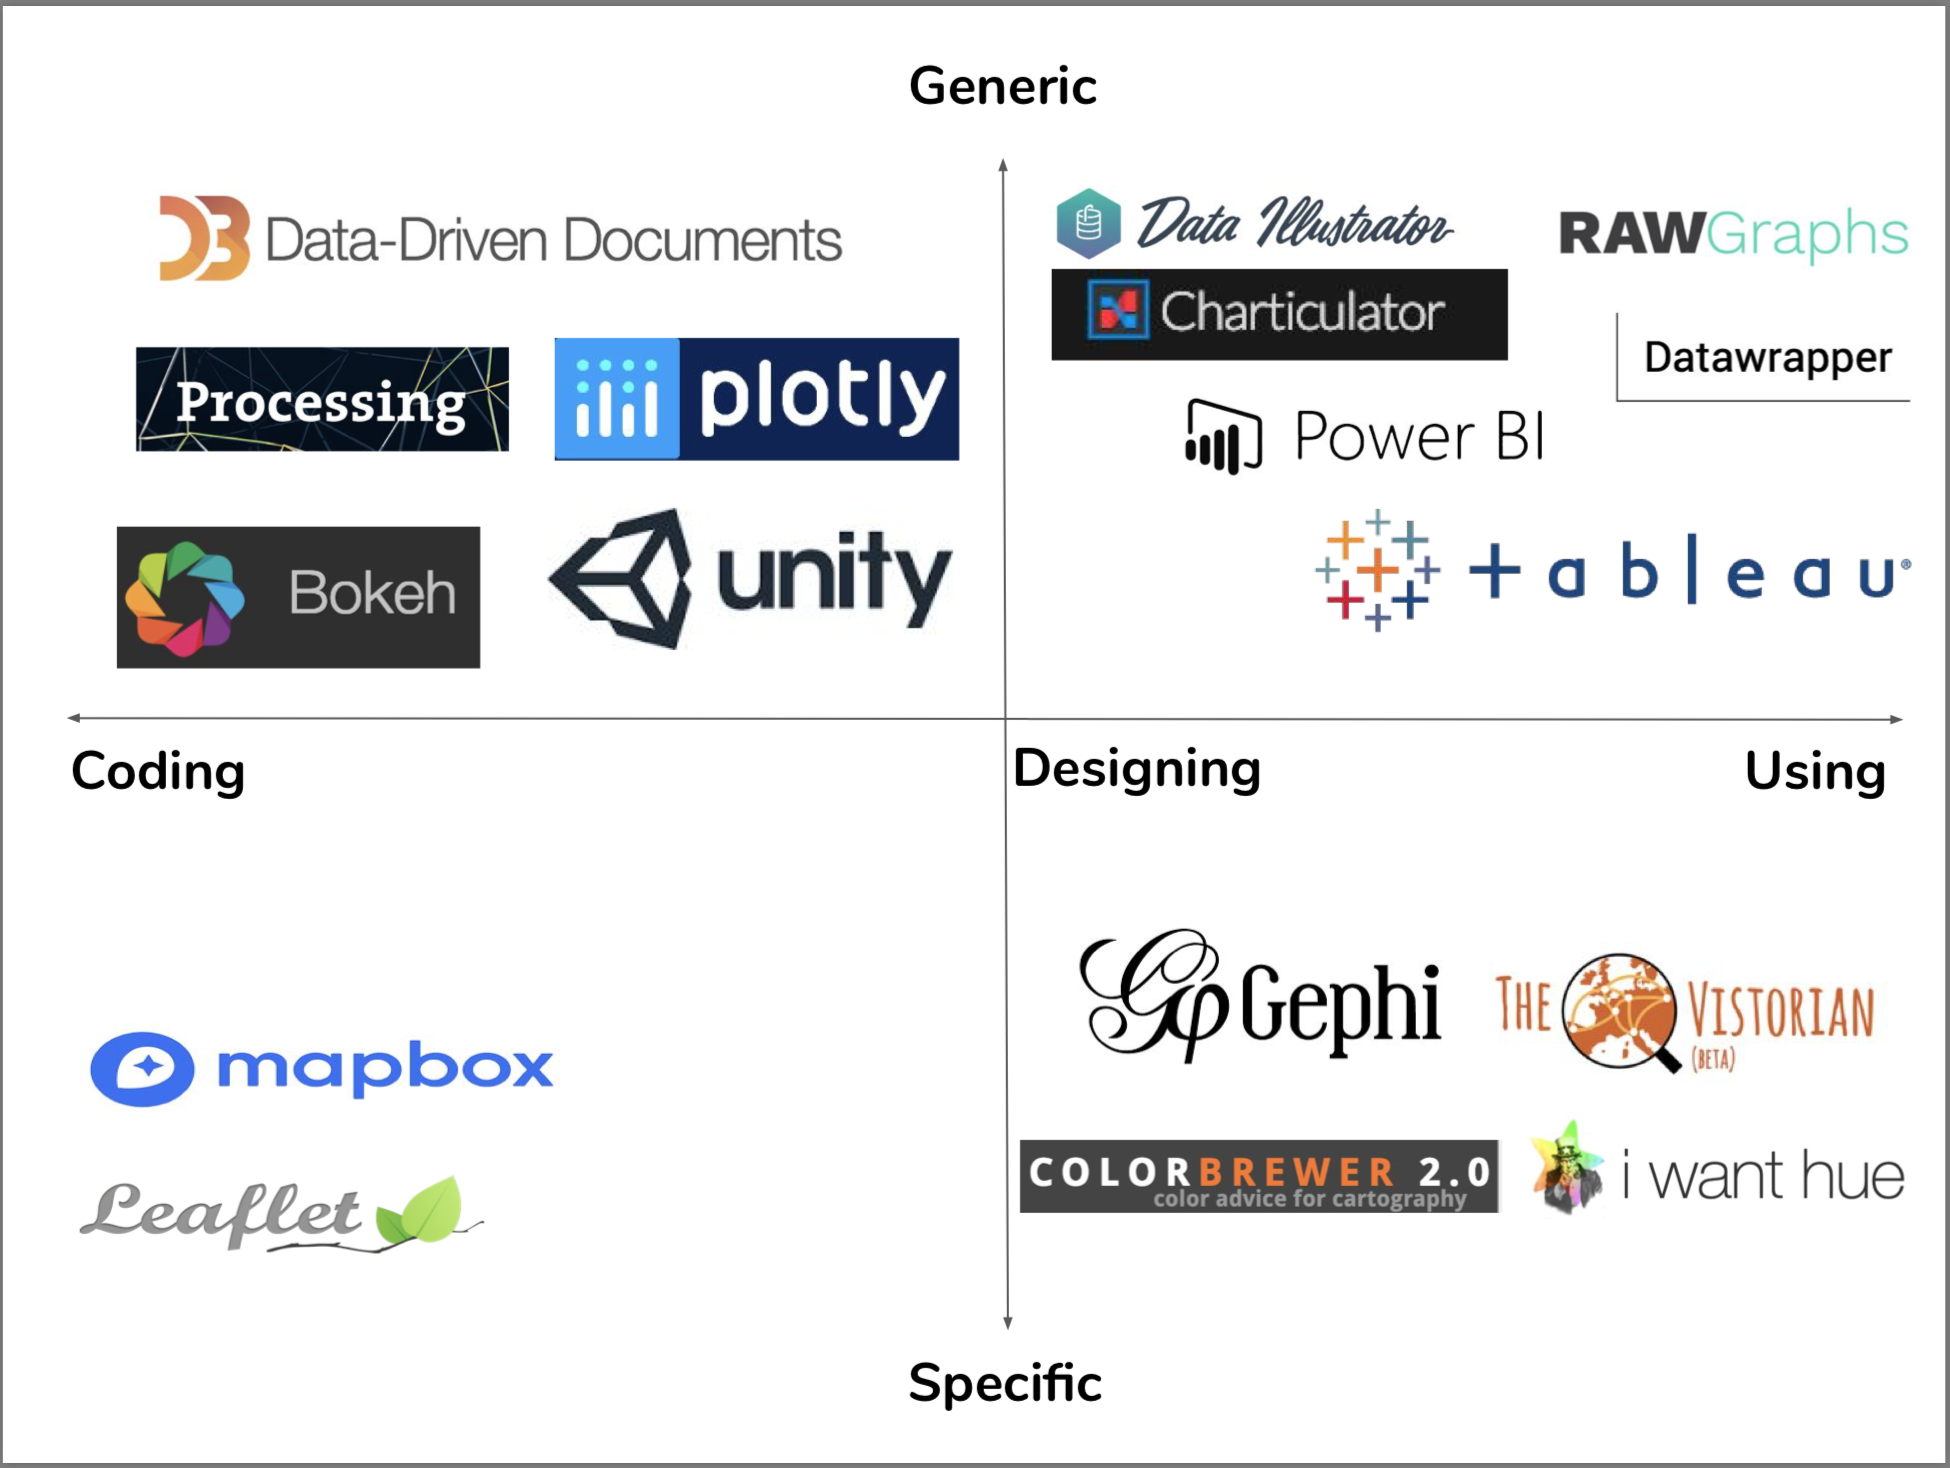
- teach how to assess and match your data needs to functionality and tools for data visualisation (with examples drawn from a variety of tools including Tableau, Rawgraphs, D3.js).
Contextual knowledge plays a key role in data interpretation and use. While this may be harnessed to create more meaningful, insightful visualisations, context may also be exploited to unfairly influence or actively mislead - topics that will be covered during the course. We encourage BYOD—Bring and work on Your Own Data projects (though unfortunately we cannot sign non-disclosure agreements). Alternatively, class examples will point to open-access data on a variety of topical issues such as climate change, gender participation (e.g., the No Ceilings project — github repository), Scotland’s Open Data Catalogues and the National Records of Scotland (NRS).
Learning Outcomes
- Analyse: Describe a challenge for a visualisation project and the reasons why visualisation is required.
- Structure: Break down the project considering its context (target audience, usage scenario), potential tasks that the visualisation should facilitate, and the characteristics of the data set.
- Design+Implement: Create a visualisation through one of various media (website, interactive, infographic, etc.) and through a self-selected set of tools (e.g., Tableau, D3.js), to match the earlier identified challenge.
- Evaluation: Critically reflect on a visualisation design and suggest constructive solutions.
- Apply: Competently apply a wide range of visualisation techniques and tools, also knowing their particular features and drawbacks.
Takeaways
- A certificate to reflect a 10 credit-bearing course at Masters-level (SCQF Level 11)
- Visual representation of your dataset that enables you to answer the challenge you defined around it before and during the course.
- Skills to develop further visual literacy to support data-driven work.
Course Summary
This course teaches general knowledge about theory, application, design, and evaluation of visualisations. The goal of the course is to enable participants to understand the potential of visualisation for exploration, analysis, and communication.
|
The course targets professionals working in, among others, finance, the sports industry, the creative industry, in journalism, education and in the public sector. It will enable participants to describe a visualisation problem, to explore the data using data visualisation, to discuss and design appropriate visualisation concepts, and to implement and critically reflect on them. The bi-disciplinary approach, from the Computer Science and Social Sciences perspectives, aims to increase accessibility and ensures both grounding in technical understanding and application across sectors.
The course is designed for an interdisciplinary audience, targeting participants with a background in design, data analysis, and other areas. In addition to core, mandatory topics that aim to develop visual literacy, participants can chose from a variety of optional, more specialised topics during the course.
General programming skills are not required but those with a good understanding of JavaScript, python or R can learn how to use visualisation libraries such as D3.js, https://d3js.org. The course will give you an overview of a range of commercial and open source tools to help you decide what works best for your project and skills.
|
The final assessment will require participants to work on an open visualisation project of their choice, which can, e.g., include their own data or use open data. The end goal could be any of, but not limited to, the following:
|
 |
|
 |
In addition to self-directed, online learning, individual help and feedback will be provided through forums and email, during weekly tutorials, and in dedicated 1-1 drop-in online-sessions with the organisers.
Tutorials and the majority of live discussion will be held online on MS Teams.
We aim to ensure course delivery is as flexible as possible to accommodate each participant’s work schedule. Course content is delivered through recorded online video lectures, suggested readings, online tutorials, and exercises that can be handed in to obtain feedback as well as optional advanced modules.